Description
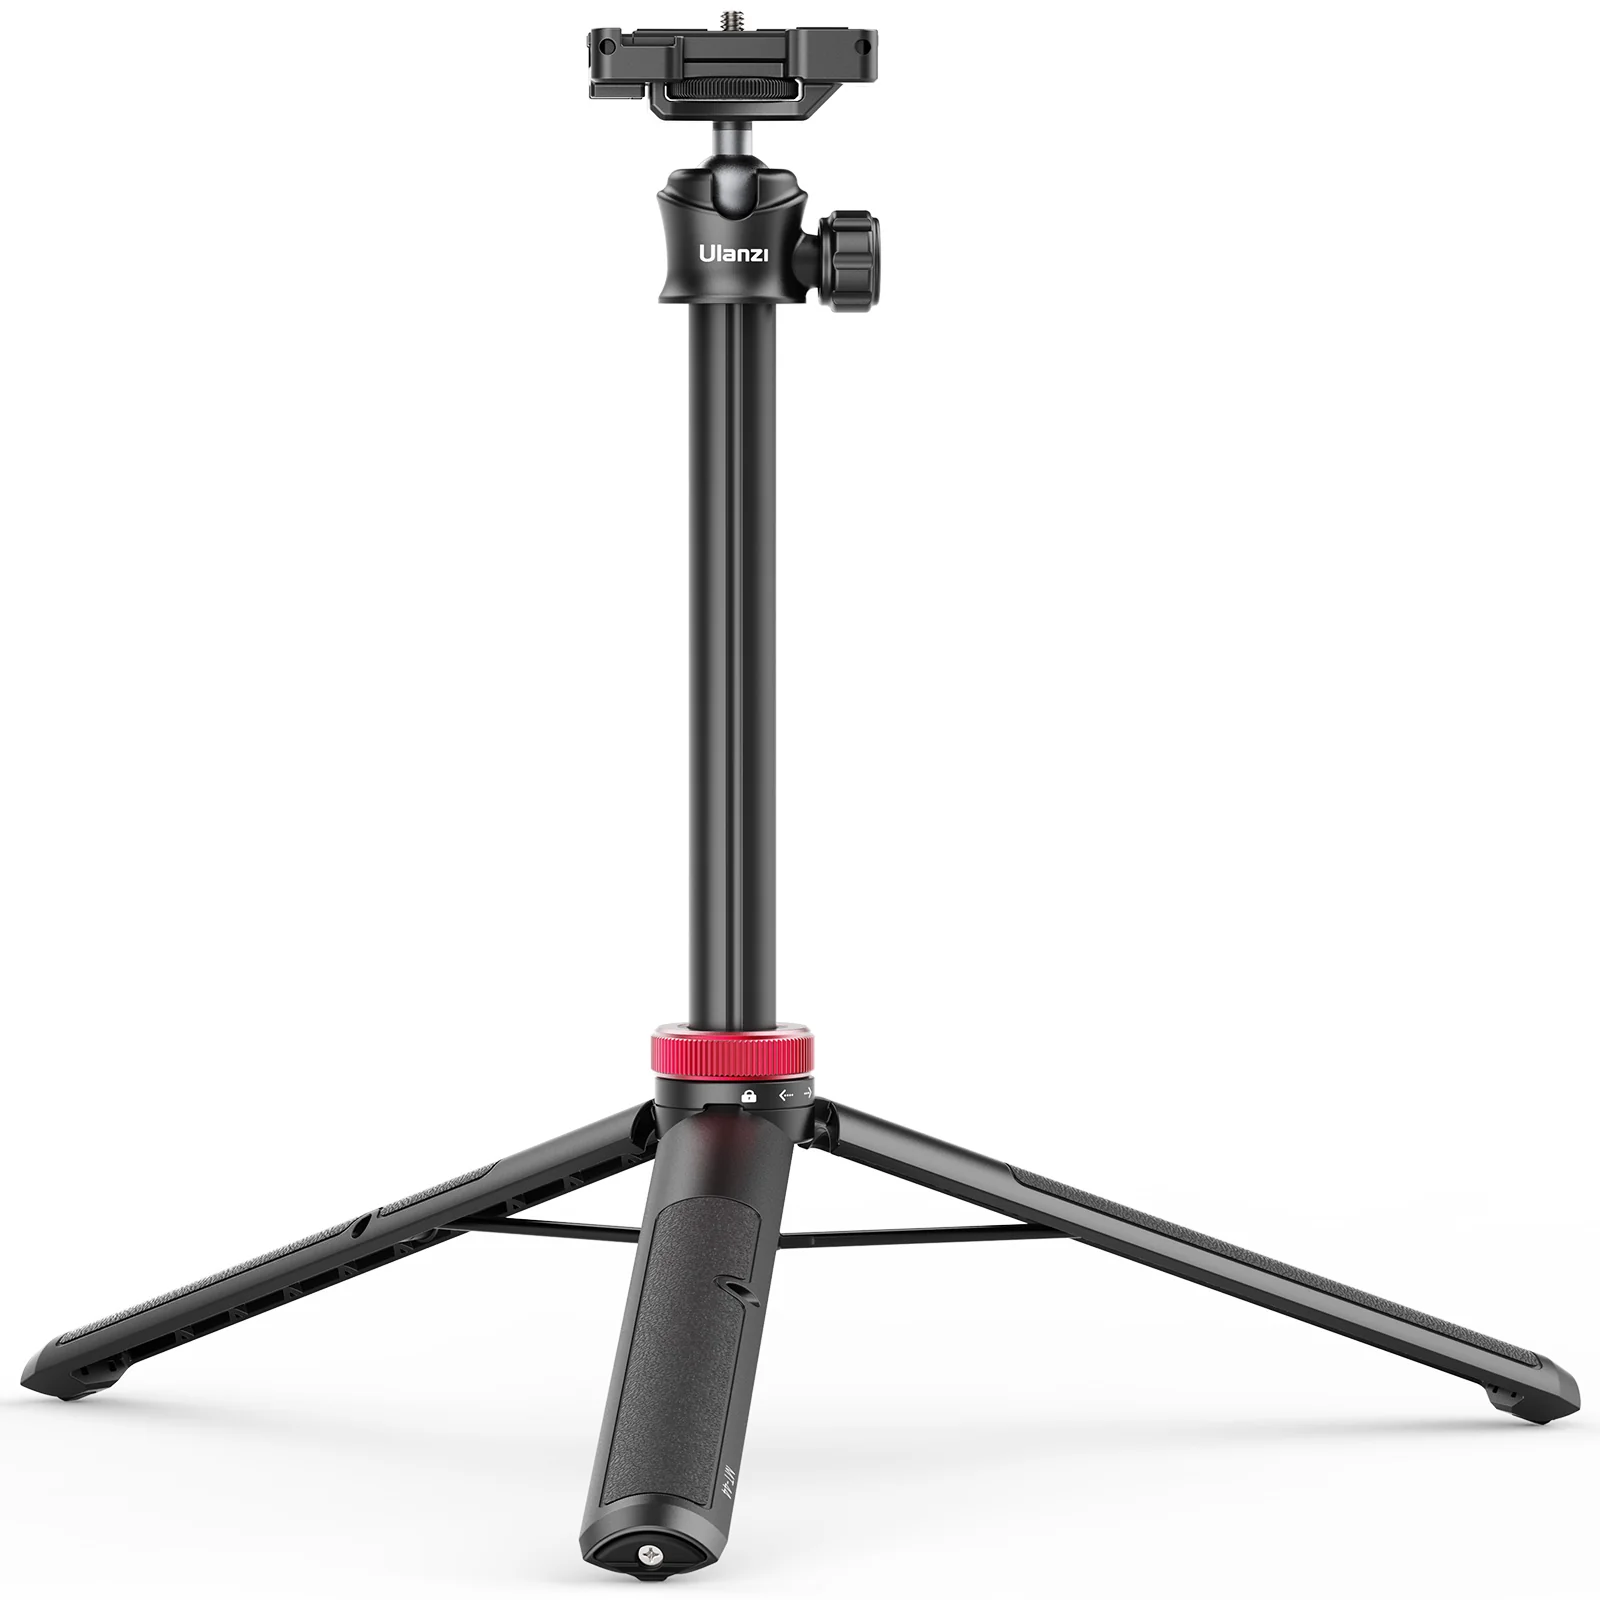
Ulanzi MT-44 Extendable Vlog Tripod Price in Bangladesh
Mobile Phone, Camera & LED Light Not Included
7 Days Replacement Warranty
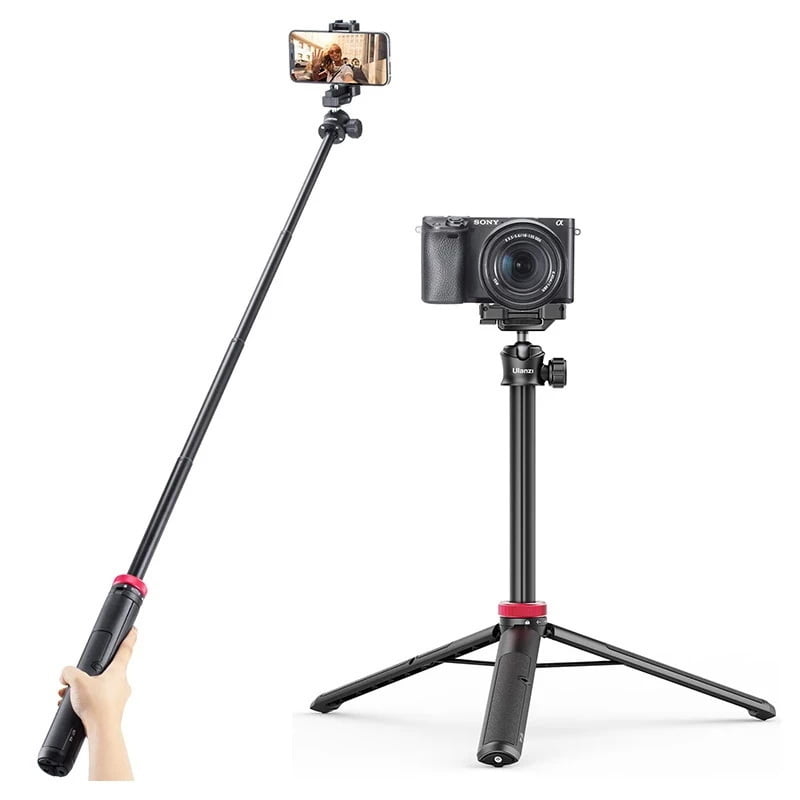
The Ulanzi MT-44 Extendable Vlog Tripod is a versatile all-in-one solution designed for vloggers, content creators, photographers, and live streamers. It functions as both a tripod and a selfie stick, making it ideal for capturing high-quality photos and videos whether you’re at home, in the studio, or on the go.
Featuring a durable 5-section telescopic design, the MT-44 extends from 12.7 inches to 43 inches, providing excellent flexibility for tabletop shooting, overhead recording, group photos, and vlogging. Its lightweight aluminum alloy construction ensures durability while remaining easy to carry and travel with.
The built-in 360° detachable ball head allows smooth rotation and up to 90° tilt adjustment, enabling effortless switching between landscape and portrait orientations. The innovative 2-in-1 mount supports both smartphones and compact cameras, making it suitable for a wide range of devices.
For added convenience, the tripod includes a cold shoe mount and a standard 1/4-inch screw interface, allowing users to attach microphones, LED lights, and other accessories for a professional content creation setup. The anti-slip tripod base provides enhanced stability on various surfaces.
Whether you’re creating YouTube videos, live streaming, video calling, or capturing memorable moments, the Ulanzi MT-44 delivers reliable performance in a compact and portable design.
Key Features
- Can be used as both a tripod and selfie stick
- Compatible with smartphones and compact cameras
- Adjustable height from 12.7″ to 43″
- 360° detachable ball head with 90° tilt adjustment
- Supports horizontal and vertical shooting modes
- Built-in 2-in-1 phone holder design
- Cold shoe mount for microphone or LED light attachment
- Standard 1/4″ screw for expanded accessory compatibility
- Lightweight and durable aluminum alloy construction
- Portable foldable design for easy carrying
Package Contents
- 1 × Ulanzi MT-44 Extendable Vlog Tripod
- 1 × User Manual
Warranty: 7 Days Replacement Warranty (Manufacturing Defects Only)